On average, from 1990 through 2019, there were 62 days per year with a change of 1% or more. … More

On average, from 1990 through 2019, there were 62 days per year with a change of 1% or more. … More

Range Gap – The current trading day’s opening price minus the prior trading day’s high (pHI) or low (pLO) when … More

Over the last 3,050 trading days: The average RTH Volume was 1,467k The median RTH Volume was 1,364k The most … More

Over the last 1,000 weeks: The average Weekly Range was 46.50pts The most common Weekly Range was 43.25pts 96.10% of … More

The average daily close from 1990 through 2019 was 19.16 4 of the 5 least volatile quarters since Jan 1990 … More

Over the last 4,532 trading days: 75.22% of the time the RTH Close was in the 2nd, 3rd or 4th … More

Over the last 5,126 trading days: 76.92% of the time the RTH Close was in the 2nd, 3rd or 4th … More
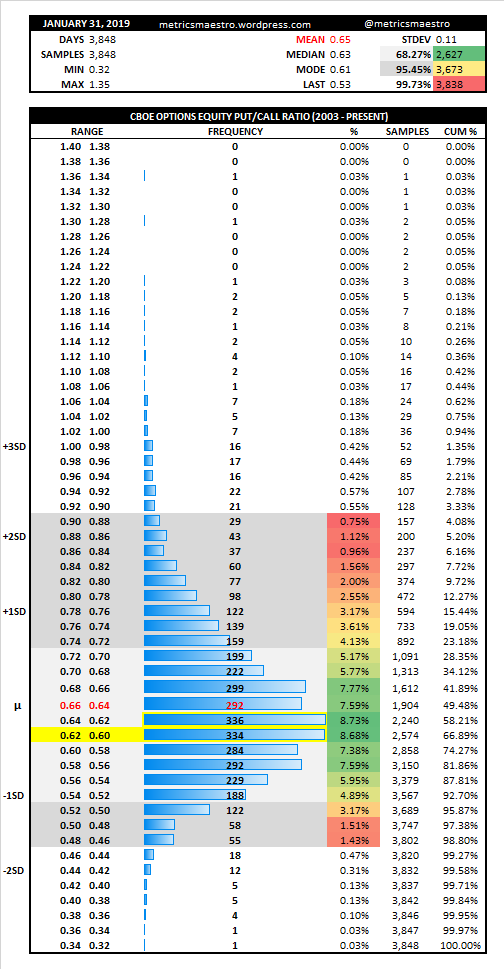
Over the last 3,848 trading days: The average Put/Call Ratio was 0.65 The median Put/Call Ratio was 0.63 The most … More

I used the non-centered method of calculating historic volatility by multiplying the standard deviation of the natural log of the … More

Over the last 2,870 trading days: The average absolute difference between the RTH Close and RTH Low was 9.50pts The … More
